Viewing files used in a page
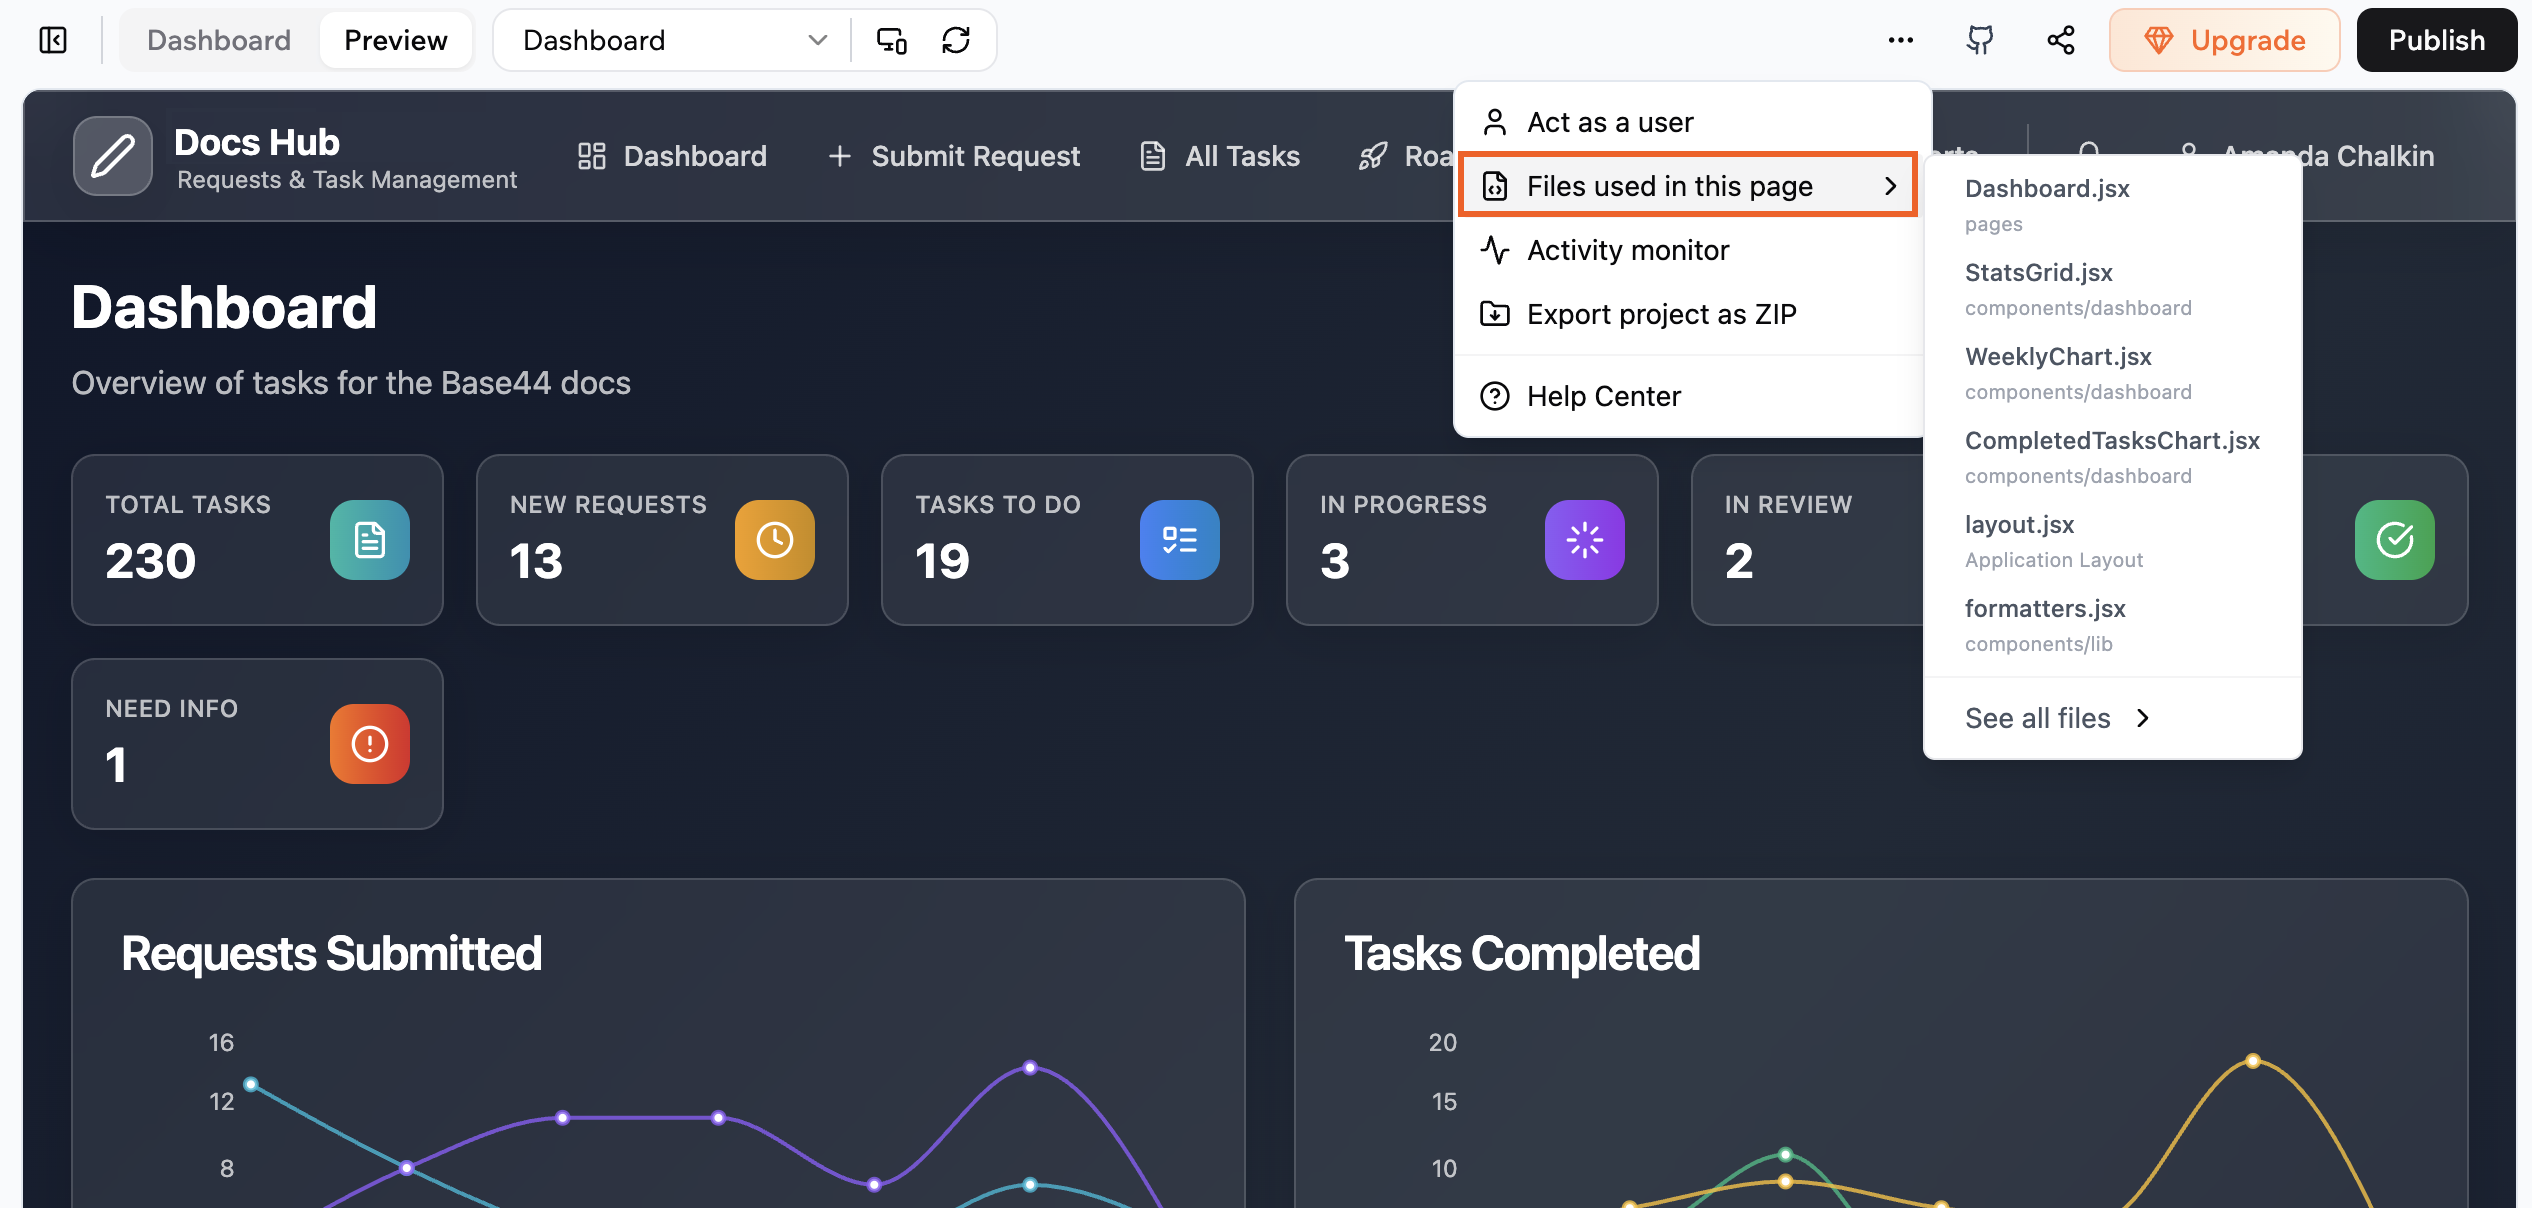
Use Files used in this page to see which app files power the page you are previewing. It shows you exactly which code files are running so you know where to go when you want to edit the page or investigate an issue. Each entry in the list shows the file name and its folder path, grouped by where it lives in your project, such as pages or components/dashboard. This gives you a quick map of the files behind the UI you see in preview and helps you understand how a complex screen is put together. To open the files used on a page:- Go to your app editor.
- Click the More Actions icon at the top right.
- Click Files used in this page.
Viewing files used on a page of your app
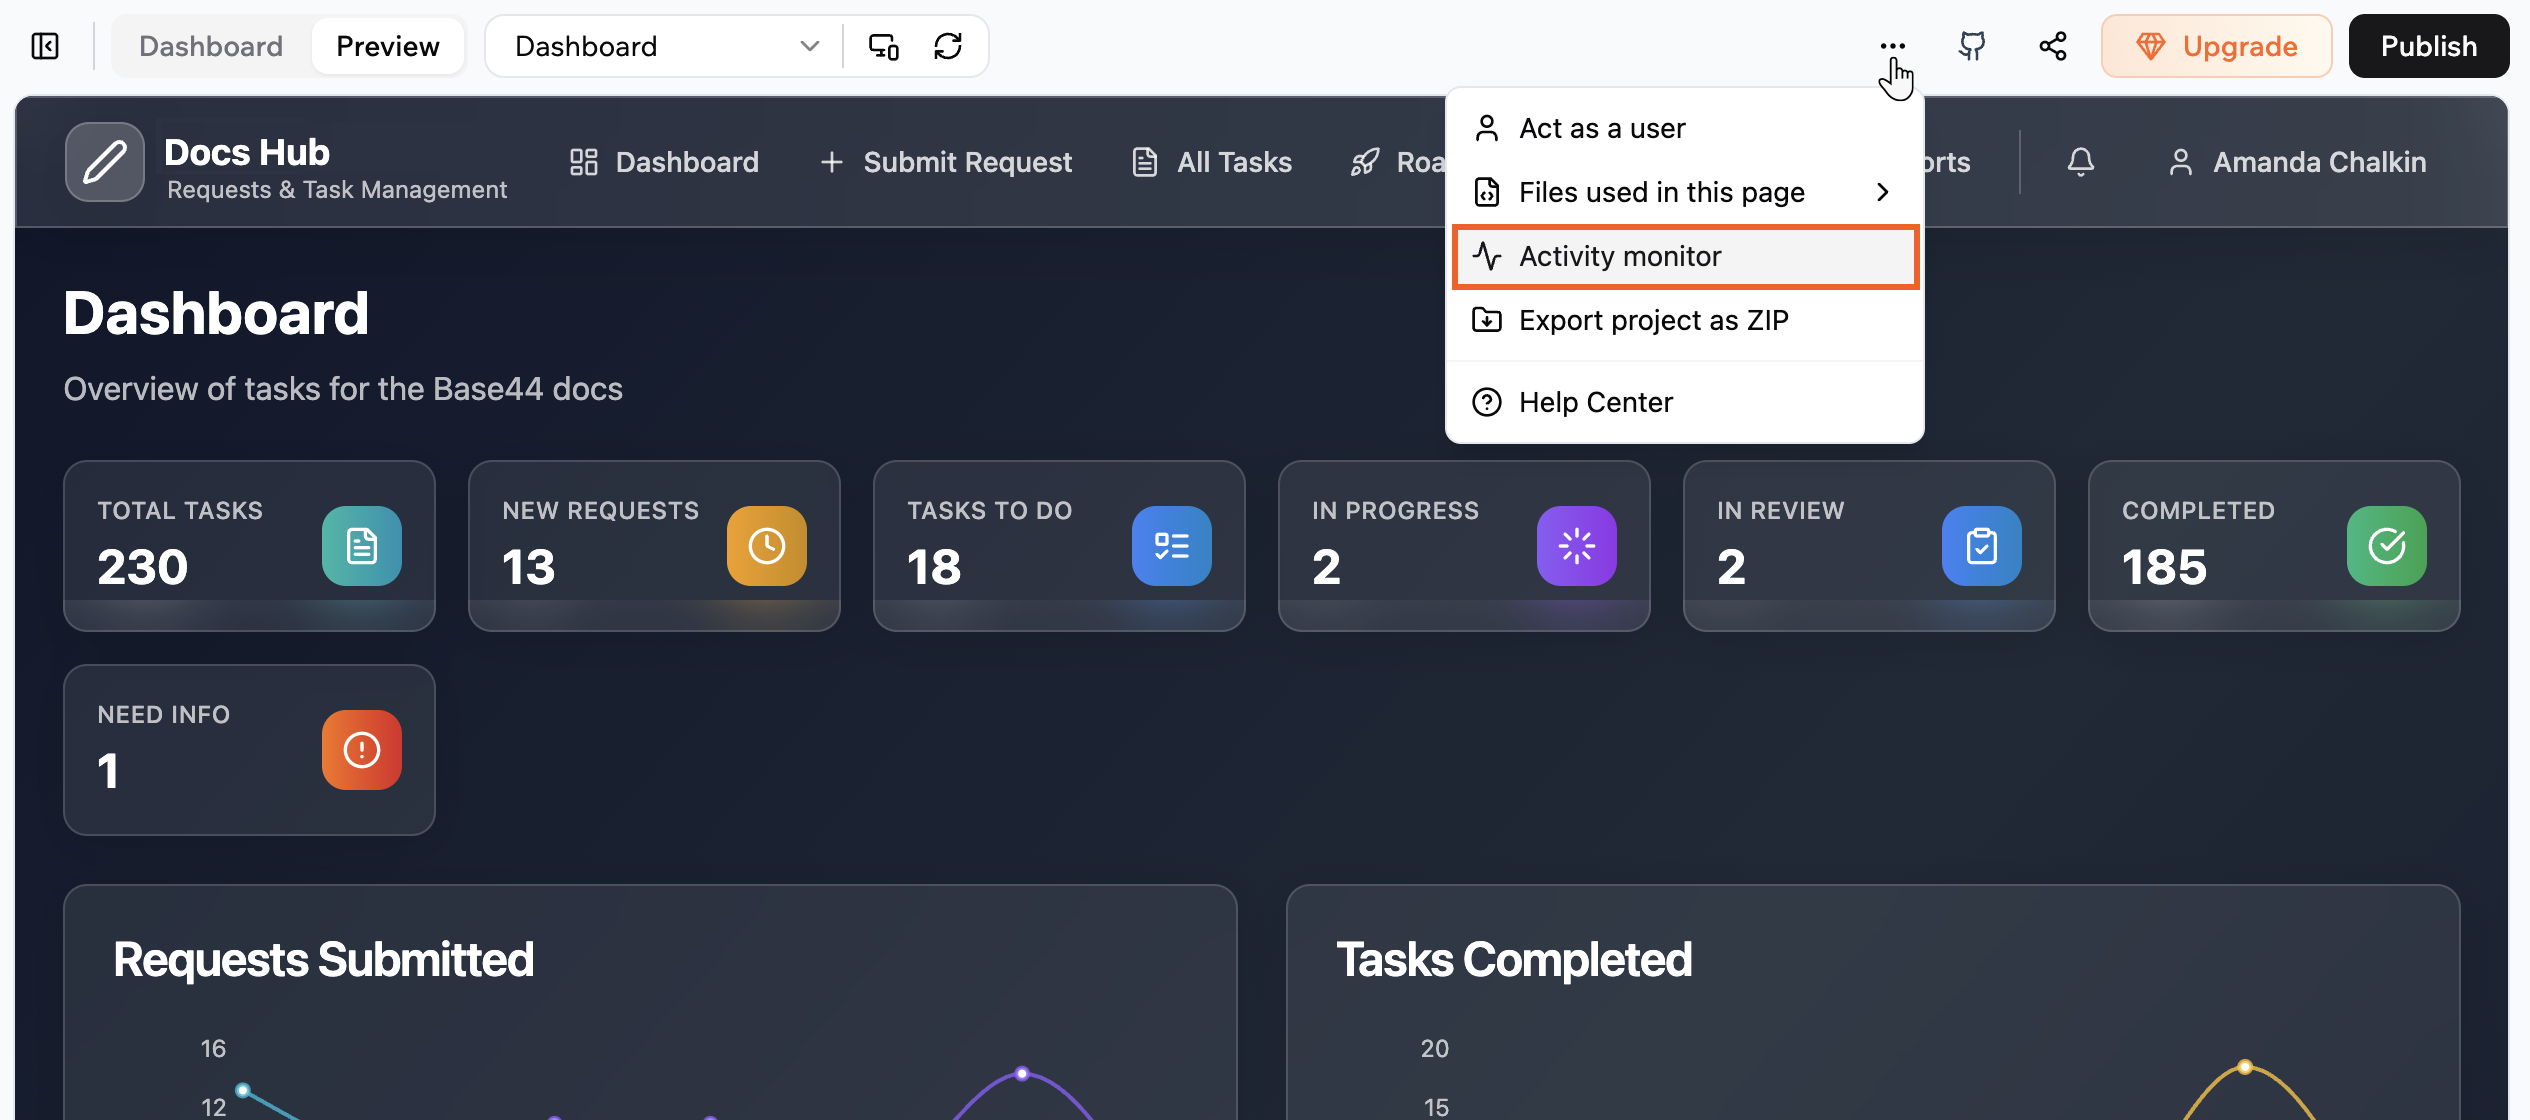
Using the activity monitor
Use Activity monitor to see every request your app makes while you are in preview. You can check which endpoints are called, see status codes and timing, and inspect request and response details to debug problems. For each entry you can see the method, such as get or post, the path, such as /entities/Notification, when it happened, and the status code, such as 200, shown on the right. You can then use the search field at the top left of the panel to filter entries by method, path, or other text. Click the filter at the top right of the panel to focus on specific types of entries. To open the activity monitor:- Go to your app editor.
- Click the More Actions icon at the top right.
- Click Activity monitor.
Accessing the activity monitor in your app editor

Investigating a request in the activity monitor
FAQs
Click a question below to learn more about developer tools in preview.Can anyone who uses my app see Activity monitor or Files used in this page?
Can anyone who uses my app see Activity monitor or Files used in this page?
No. These tools are only available to you and your app collaborators while you are in preview. People who use your published app do not see these panels or any of the data inside them.
What should I check first when a request fails in Activity monitor?
What should I check first when a request fails in Activity monitor?
Start by opening the failed entry and checking the Status and Response tabs. Look at the status code, any error message in the response body, and key headers, such as authentication. From there, use Files used in this page to open the file that triggers the request so you can fix the logic.
Can Activity monitor help with performance tuning, not just errors?
Can Activity monitor help with performance tuning, not just errors?
Yes. The Time values in the General tab show how long each request takes. You can click through slow calls to see which endpoints or flows are taking the most time and then focus on improving those specific parts of your app.