Checking your app performance
Your app’s performance affects how quickly it loads and responds to users. You can measure this using your browser’s Developer Tools. The key performance metrics include: Largest Contentful Paint (LCP), Cumulative Layout Shift (CLS), and Interaction to Next Paint (INP).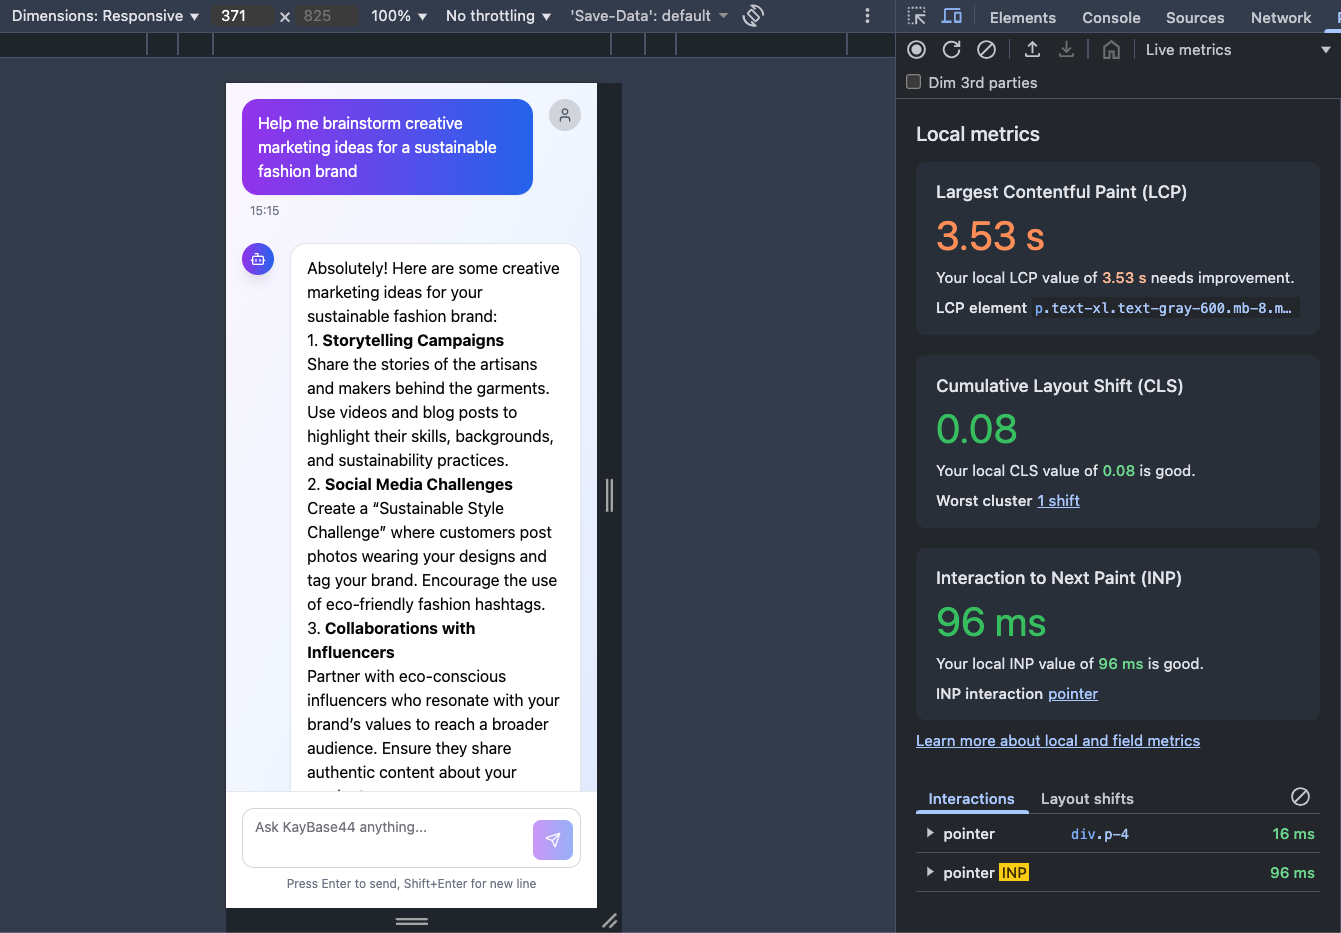
Optimizing your app performance
Optimize your app’s performance by focusing on the key metrics that affect how fast it loads, runs, and responds. Each one highlights a different aspect of the user experience, and you can prompt the Base44 AI chat to optimize them directly.Largest Contentful Paint (LCP)
LCP measures the time it takes for the largest visible element (image, text, or video) above the fold to appear. To optimize LCP:- Keep visible content above the fold light and fast.
- Move heavy elements (videos, iFrames, grids, lists) below the fold.
- Optimize and compress images before uploading.
- Use lazy loading for offscreen images.
Cumulative Layout Shift (CLS)
CLS measures unexpected movement in your app’s layout while loading. To optimize CLS:- Add size definitions: Give every image and video fixed height and width to avoid shifting as they load.
- Optimize custom fonts: Use the
font-display: swap;property in your CSS to prevent invisible text during font loading. - Reserve space for dynamic content: Set fixed spaces for ads, pop-ups, or anything that loads after the initial render.
- Minimize DOM updates: Limit layout changes caused by automatic scripts.
Interaction to Next Paint (INP)
INP measures how fast your app responds to clicks, taps, or keyboard input. To optimize INP:- Avoid long-running scripts triggered by user actions.
- Defer or remove non-essential scripts from the initial load.
- Keep layouts simple and animations minimal.
- Monitor responsiveness in the Performance tab.
Content Delivery Network (CDN) and caching
A Content Delivery Network (CDN) delivers copies of your app from servers closest to the user’s location, improving load times. Base44 automatically uses Cloudflare CDN for caching and delivery.Currently, you can’t clear the CDN cache manually.
FAQs
Click a question below to learn more about optimizing site performance.How do I check my app performance?
How do I check my app performance?
You can check your app’s performance using Chrome DevTools or Google PageSpeed Insights.To check with Chrome:
- Quick check:
- Open your published app.
- Right-click anywhere and select Inspect.
- In the right panel, Chrome displays local metrics for Largest Contentful Paint (LCP), Cumulative Layout Shift (CLS), and Interaction to Next Paint (INP).
This gives you an instant view of how your live page performs.
- Detailed check:
- Open Chrome DevTools.
- Click the Performance tab.
- Click Record, reload the page, and stop recording once it finishes loading.
- Review the full performance timeline, including First Contentful Paint (FCP), LCP, and main-thread activity.
- Go to PageSpeed Insights.
- Enter your app’s URL and click Analyze.
- Review the Insights and Diagnostics sections for ways to improve your app’s performance.
What performance score should I aim for?
What performance score should I aim for?
Aim to meet or exceed these recommended scores for the best experience:
- Largest Contentful Paint (LCP): 2.5 seconds or less.
- Cumulative Layout Shift (CLS): 0.1 or less.
- Interaction to Next Paint (INP): 200 milliseconds or less.
Why is my app getting a low score?
Why is my app getting a low score?
A low performance score usually means some elements on your site are taking longer to load than expected. Heavy above-the-fold content, large scripts, or unoptimized media are the most common causes.To troubleshoot:
- Run your app through Google PageSpeed Insights and check for:
- Render-blocking resources: move scripts to
asyncordefer. - Large JavaScript bundles: simplify or split vendor code.
- Unoptimized images: compress and re-upload.
- Render-blocking resources: move scripts to
- In Chrome DevTools, open the Network tab and click Reload to see how your files load in real time.
- Watch for files taking more than 1–2 seconds to load — these are likely slowing your app.
- Move videos, data lists, or heavy sections below the fold.
- Compress and resize images before uploading.
- Remove unused scripts or CSS.
- Republish your app to refresh CDN caching.
How do I make videos or animations load faster?
How do I make videos or animations load faster?
- Host videos externally (e.g. on Vimeo or YouTube).
- Add
loading="lazy"to embedded videos or iframes. - Place videos below the fold to prioritize text and images.
- Disable autoplay or loop for large background videos.
Why is my PageSpeed score lower on mobile?
Why is my PageSpeed score lower on mobile?
Mobile tests run on slower networks and devices, so scores are usually lower than desktop. Focus on optimizing your LCP and INP for mobile first by reducing heavy media, deferring non-critical scripts, and simplifying layouts.