> ## Documentation Index
> Fetch the complete documentation index at: https://docs.base44.com/llms.txt
> Use this file to discover all available pages before exploring further.
# Optimizing App Performance
> Check your app’s performance metrics and optimize loading speed and responsiveness.
## Checking your app performance
Your app’s performance affects how quickly it loads and responds to users. You can measure this using your browser’s **Developer Tools**.
The key performance metrics include: **Largest Contentful Paint (LCP)**, **Cumulative Layout Shift (CLS)**, and **Interaction to Next Paint (INP)**.
Always check your **published app**, not the builder preview. Performance scores are most accurate when testing the live version on both desktop and mobile.
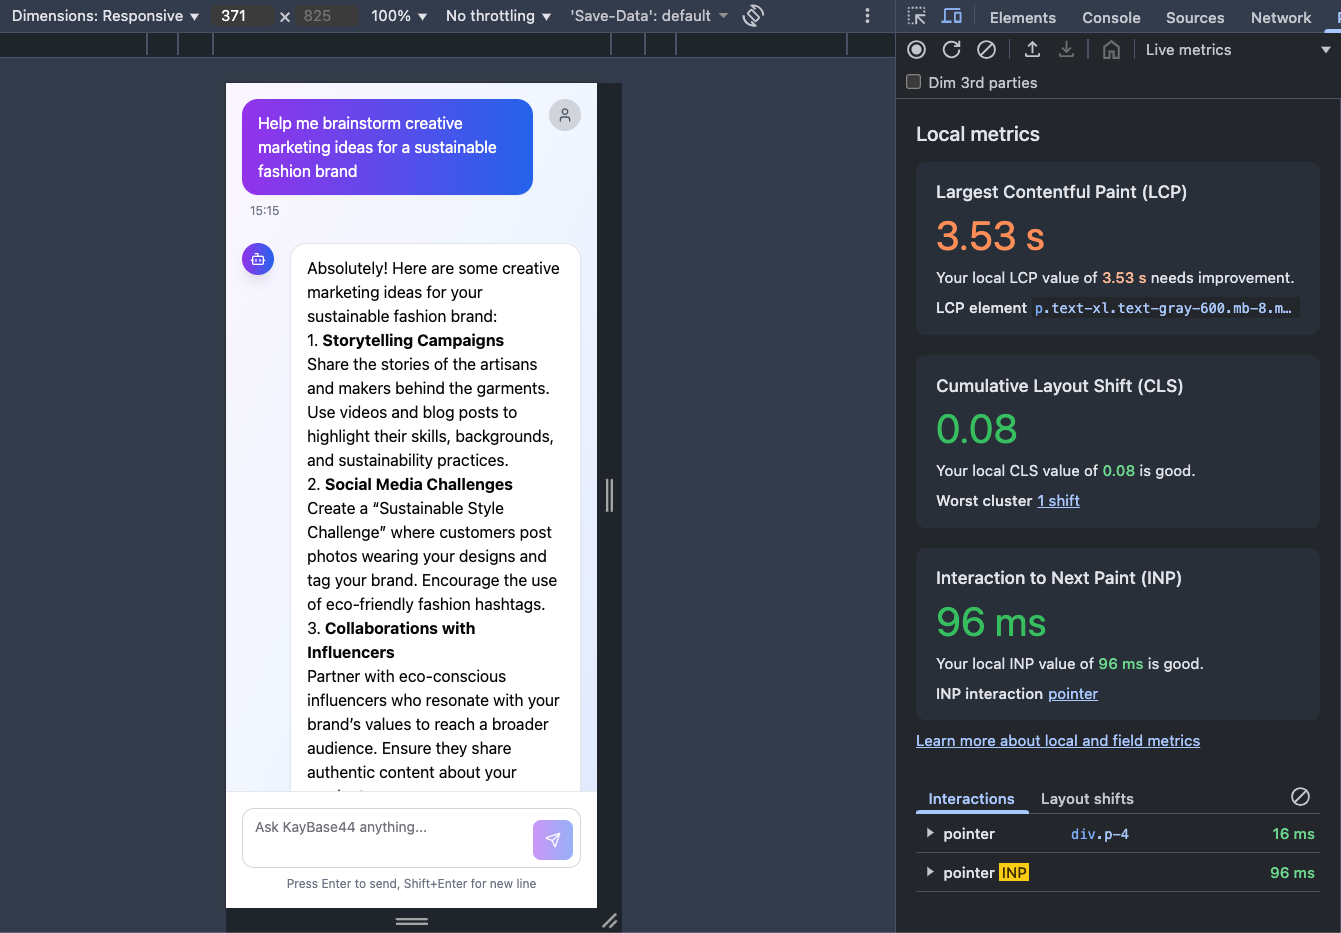 *Example of Chrome DevTools displaying local performance metrics for LCP, CLS, and INP.*
## Optimizing your app performance
Optimize your app’s performance by focusing on the key metrics that affect how fast it loads, runs, and responds. Each one highlights a different aspect of the user experience, and you can prompt the Base44 AI chat to optimize them directly.
### Largest Contentful Paint (LCP)
LCP measures the time it takes for the largest visible element (image, text, or video) above the fold to appear.
**To optimize LCP:**
* Keep visible content above the fold light and fast.
* Move heavy elements (videos, iFrames, grids, lists) below the fold.
* Optimize and compress images before uploading.
* Use **lazy loading** for offscreen images.
*Prompt the AI:* "Apply lazy loading to images and videos below the fold."\
The AI will automatically add the proper attributes or dynamic imports.
### Cumulative Layout Shift (CLS)
CLS measures unexpected movement in your app's layout while loading.
**To optimize CLS:**
* **Add size definitions:** Give every image and video fixed height and width to avoid shifting as they load.
* **Optimize custom fonts:** Use the `font-display: swap;` property in your CSS to prevent invisible text during font loading.
* **Reserve space for dynamic content:** Set fixed spaces for ads, pop-ups, or anything that loads after the initial render.
* **Minimize DOM updates:** Limit layout changes caused by automatic scripts.
*Prompt the AI:*
* “Set fixed height and width for all media elements."
* “Prevent layout shifts while fonts load.”
The AI will automatically update the component styles or CSS.
### Interaction to Next Paint (INP)
INP measures how fast your app responds to clicks, taps, or keyboard input.
**To optimize INP:**
* Avoid long-running scripts triggered by user actions.
* Defer or remove non-essential scripts from the initial load.
* Keep layouts simple and animations minimal.
* Monitor responsiveness in the **Performance** tab.
*Prompt the AI:* “Defer non-critical scripts until after interaction” or “Simplify animations for better responsiveness.” The AI will optimize code execution order and animations during generation.
### Content Delivery Network (CDN) and caching
A **Content Delivery Network (CDN)** delivers copies of your app from servers closest to the user’s location, improving load times. Base44 automatically uses **Cloudflare CDN** for caching and delivery.
*Prompt the AI:* “Republish my app to refresh cached files.”\
Republishing triggers Base44’s automatic Cloudflare cache update.
Currently, you can't clear the CDN cache manually.
***
## FAQs
Click a question below to learn more about optimizing site performance.
You can check your app’s performance using **Chrome DevTools** or **Google PageSpeed Insights**.
**To check with Chrome:**
* **Quick check:**
1. Open your **published app**.
2. Right-click anywhere and select **Inspect**.
3. In the right panel, Chrome displays local metrics for **Largest Contentful Paint (LCP)**, **Cumulative Layout Shift (CLS)**, and **Interaction to Next Paint (INP)**.\
This gives you an instant view of how your live page performs.
* **Detailed check:**
1. Open **Chrome DevTools**.
2. Click the **Performance** tab.
3. Click **Record**, reload the page, and stop recording once it finishes loading.
4. Review the full performance timeline, including **First Contentful Paint (FCP)**, **LCP**, and main-thread activity.
**To check with PageSpeed:**
1. Go to [PageSpeed Insights](https://pagespeed.web.dev).
2. Enter your app’s URL and click **Analyze**.
3. Review the **Insights** and **Diagnostics** sections for ways to improve your app’s performance.
Aim to meet or exceed these recommended scores for the best experience:
* **Largest Contentful Paint (LCP):** 2.5 seconds or less.
* **Cumulative Layout Shift (CLS):** 0.1 or less.
* **Interaction to Next Paint (INP):** 200 milliseconds or less.
These benchmarks follow Google’s standards for excellent site performance and help ensure your app runs fast, stays stable, and responds smoothly.
A low performance score usually means some elements on your site are taking longer to load than expected. Heavy above-the-fold content, large scripts, or unoptimized media are the most common causes.
**To troubleshoot:**
1. Run your app through [Google PageSpeed Insights](https://pagespeed.web.dev) and check for:
* **Render-blocking resources:** move scripts to `async` or `defer`.
* **Large JavaScript bundles:** simplify or split vendor code.
* **Unoptimized images:** compress and re-upload.
2. In **Chrome DevTools**, open the **Network** tab and click **Reload** to see how your files load in real time.
* Watch for files taking more than 1–2 seconds to load — these are likely slowing your app.
**Quick fixes:**
* Move videos, data lists, or heavy sections below the fold.
* Compress and resize images before uploading.
* Remove unused scripts or CSS.
* Republish your app to refresh CDN caching.
*Prompt the AI:* “Optimize my app for faster LCP and INP” or “Reduce above-the-fold load size.” The AI will automatically apply lazy loading and script deferring where relevant.
* Host videos externally (e.g. on **Vimeo** or **YouTube**).
* Add `loading="lazy"` to embedded videos or iframes.
* Place videos **below the fold** to prioritize text and images.
* Disable **autoplay** or **loop** for large background videos.
Mobile tests run on slower networks and devices, so scores are usually lower than desktop. Focus on optimizing your **LCP** and **INP** for mobile first by reducing heavy media, deferring non-critical scripts, and simplifying layouts.
*Example of Chrome DevTools displaying local performance metrics for LCP, CLS, and INP.*
## Optimizing your app performance
Optimize your app’s performance by focusing on the key metrics that affect how fast it loads, runs, and responds. Each one highlights a different aspect of the user experience, and you can prompt the Base44 AI chat to optimize them directly.
### Largest Contentful Paint (LCP)
LCP measures the time it takes for the largest visible element (image, text, or video) above the fold to appear.
**To optimize LCP:**
* Keep visible content above the fold light and fast.
* Move heavy elements (videos, iFrames, grids, lists) below the fold.
* Optimize and compress images before uploading.
* Use **lazy loading** for offscreen images.
*Prompt the AI:* "Apply lazy loading to images and videos below the fold."\
The AI will automatically add the proper attributes or dynamic imports.
### Cumulative Layout Shift (CLS)
CLS measures unexpected movement in your app's layout while loading.
**To optimize CLS:**
* **Add size definitions:** Give every image and video fixed height and width to avoid shifting as they load.
* **Optimize custom fonts:** Use the `font-display: swap;` property in your CSS to prevent invisible text during font loading.
* **Reserve space for dynamic content:** Set fixed spaces for ads, pop-ups, or anything that loads after the initial render.
* **Minimize DOM updates:** Limit layout changes caused by automatic scripts.
*Prompt the AI:*
* “Set fixed height and width for all media elements."
* “Prevent layout shifts while fonts load.”
The AI will automatically update the component styles or CSS.
### Interaction to Next Paint (INP)
INP measures how fast your app responds to clicks, taps, or keyboard input.
**To optimize INP:**
* Avoid long-running scripts triggered by user actions.
* Defer or remove non-essential scripts from the initial load.
* Keep layouts simple and animations minimal.
* Monitor responsiveness in the **Performance** tab.
*Prompt the AI:* “Defer non-critical scripts until after interaction” or “Simplify animations for better responsiveness.” The AI will optimize code execution order and animations during generation.
### Content Delivery Network (CDN) and caching
A **Content Delivery Network (CDN)** delivers copies of your app from servers closest to the user’s location, improving load times. Base44 automatically uses **Cloudflare CDN** for caching and delivery.
*Prompt the AI:* “Republish my app to refresh cached files.”\
Republishing triggers Base44’s automatic Cloudflare cache update.
Currently, you can't clear the CDN cache manually.
***
## FAQs
Click a question below to learn more about optimizing site performance.
You can check your app’s performance using **Chrome DevTools** or **Google PageSpeed Insights**.
**To check with Chrome:**
* **Quick check:**
1. Open your **published app**.
2. Right-click anywhere and select **Inspect**.
3. In the right panel, Chrome displays local metrics for **Largest Contentful Paint (LCP)**, **Cumulative Layout Shift (CLS)**, and **Interaction to Next Paint (INP)**.\
This gives you an instant view of how your live page performs.
* **Detailed check:**
1. Open **Chrome DevTools**.
2. Click the **Performance** tab.
3. Click **Record**, reload the page, and stop recording once it finishes loading.
4. Review the full performance timeline, including **First Contentful Paint (FCP)**, **LCP**, and main-thread activity.
**To check with PageSpeed:**
1. Go to [PageSpeed Insights](https://pagespeed.web.dev).
2. Enter your app’s URL and click **Analyze**.
3. Review the **Insights** and **Diagnostics** sections for ways to improve your app’s performance.
Aim to meet or exceed these recommended scores for the best experience:
* **Largest Contentful Paint (LCP):** 2.5 seconds or less.
* **Cumulative Layout Shift (CLS):** 0.1 or less.
* **Interaction to Next Paint (INP):** 200 milliseconds or less.
These benchmarks follow Google’s standards for excellent site performance and help ensure your app runs fast, stays stable, and responds smoothly.
A low performance score usually means some elements on your site are taking longer to load than expected. Heavy above-the-fold content, large scripts, or unoptimized media are the most common causes.
**To troubleshoot:**
1. Run your app through [Google PageSpeed Insights](https://pagespeed.web.dev) and check for:
* **Render-blocking resources:** move scripts to `async` or `defer`.
* **Large JavaScript bundles:** simplify or split vendor code.
* **Unoptimized images:** compress and re-upload.
2. In **Chrome DevTools**, open the **Network** tab and click **Reload** to see how your files load in real time.
* Watch for files taking more than 1–2 seconds to load — these are likely slowing your app.
**Quick fixes:**
* Move videos, data lists, or heavy sections below the fold.
* Compress and resize images before uploading.
* Remove unused scripts or CSS.
* Republish your app to refresh CDN caching.
*Prompt the AI:* “Optimize my app for faster LCP and INP” or “Reduce above-the-fold load size.” The AI will automatically apply lazy loading and script deferring where relevant.
* Host videos externally (e.g. on **Vimeo** or **YouTube**).
* Add `loading="lazy"` to embedded videos or iframes.
* Place videos **below the fold** to prioritize text and images.
* Disable **autoplay** or **loop** for large background videos.
Mobile tests run on slower networks and devices, so scores are usually lower than desktop. Focus on optimizing your **LCP** and **INP** for mobile first by reducing heavy media, deferring non-critical scripts, and simplifying layouts.