> ## Documentation Index
> Fetch the complete documentation index at: https://docs.base44.com/llms.txt
> Use this file to discover all available pages before exploring further.
# Exploring app logs
> Use the Logs page to review everything that happens in your app, from user activity and function calls to schema and integration changes, and fix issues fast.
The **Logs** page gives you a searchable history of everything that happens in your app, from user actions and function calls to schema and integration changes. Use it to troubleshoot problems, confirm that automations ran, and review who did what in your app.
***
## Accessing your logs
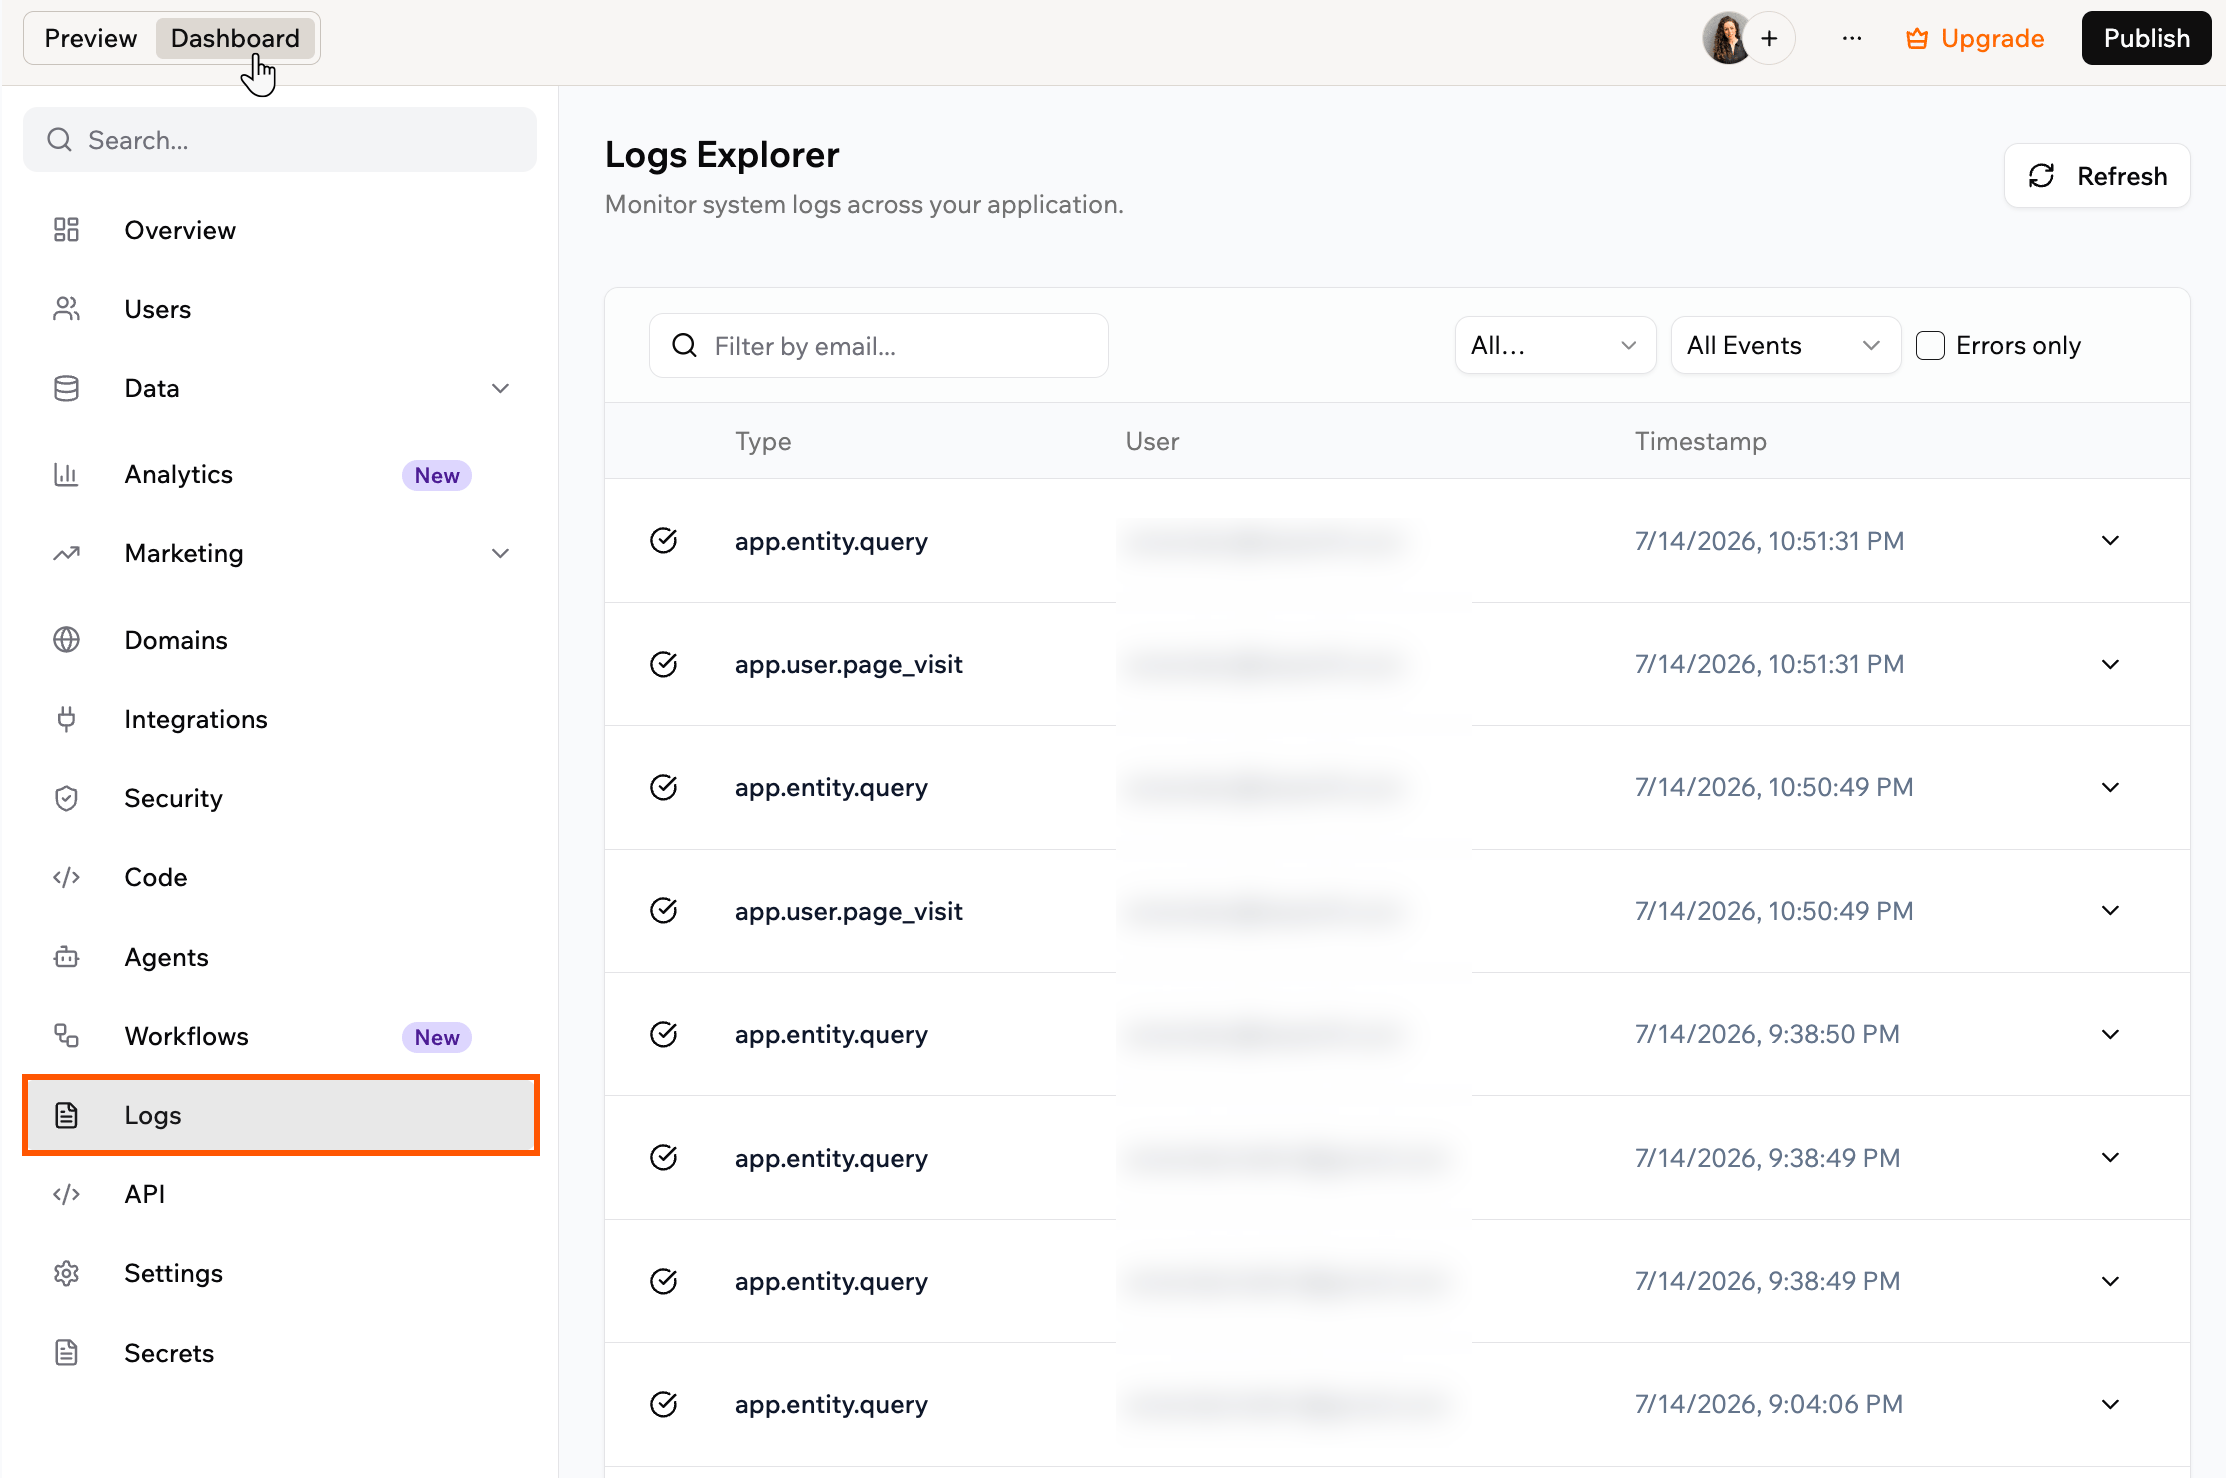
Your logs live on the **Logs** page in your app dashboard. It opens the **Logs Explorer**, a table of events with a **Type**, **User**, and **Timestamp** column. Click any row to expand its full details.
**To access your logs:**
1. Go to your app editor.
2. Click **Dashboard**.
3. Click **Logs** in the sidebar.
 ***
## Understanding log categories
Logs are grouped into two categories.
* **Runtime:** Activity that happens while people use your app. This includes entity operations (created, updated, deleted, restored), user events (registered, login, invited, role changed, page visits), access requests, function calls, integration and automation executions, agent conversations, data imports, file uploads, and security checks.
* **Setup:** Changes to how your app is built and configured. This includes app lifecycle events (created, published, unpublished), entity schema changes, payment and OAuth integration setup, and domain changes.
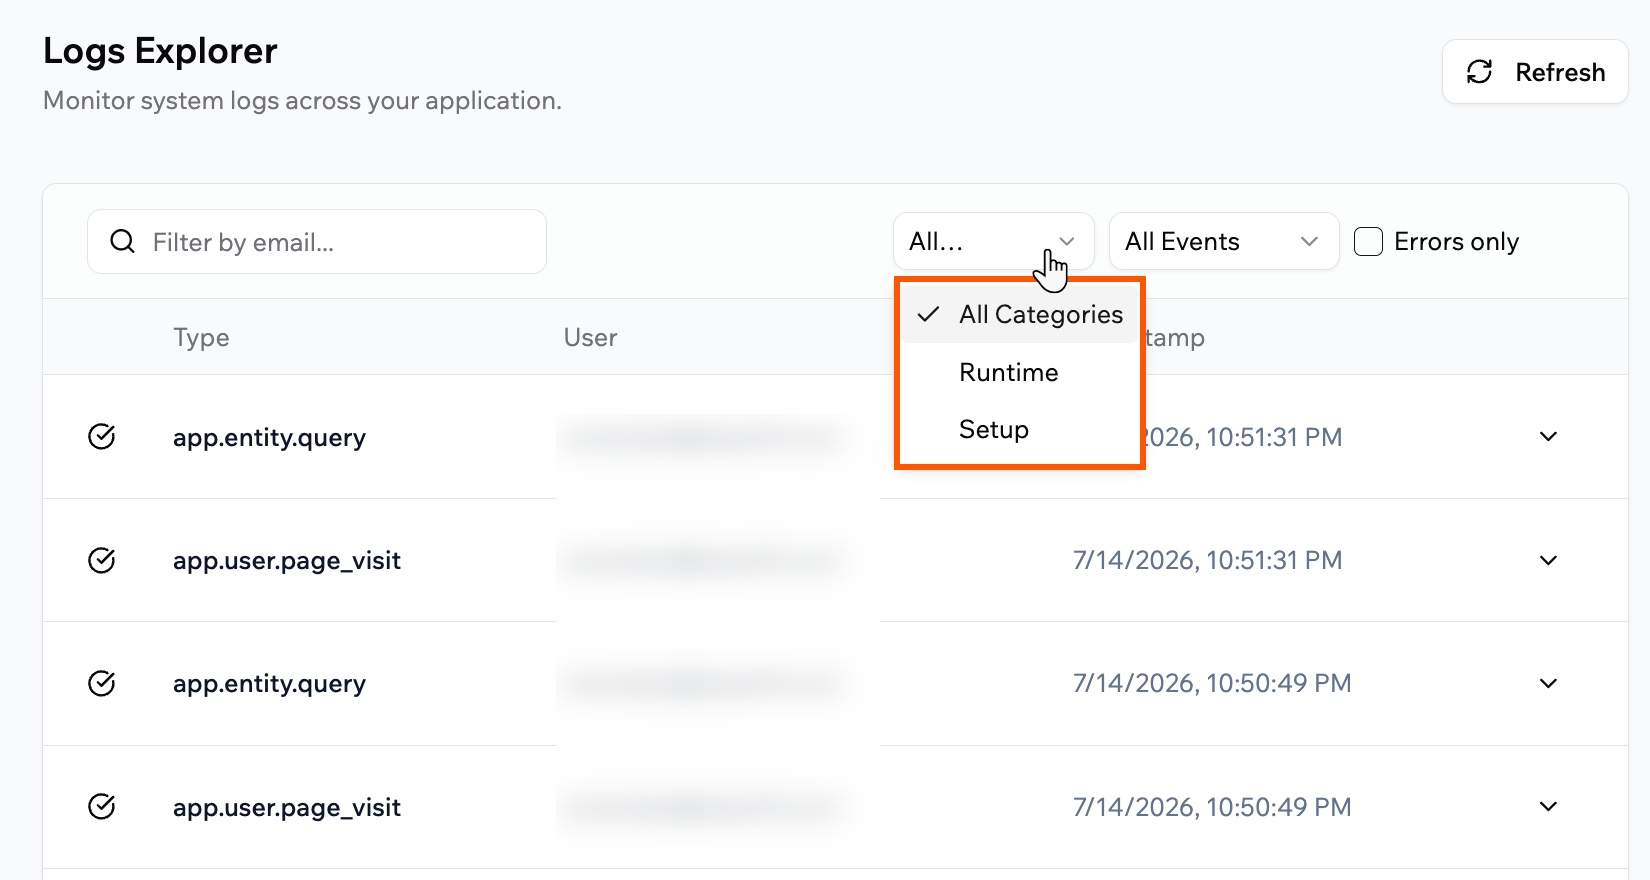
To focus on one category, use the category dropdown above the table and select **All Categories**, **Runtime**, or **Setup**.
***
## Understanding log categories
Logs are grouped into two categories.
* **Runtime:** Activity that happens while people use your app. This includes entity operations (created, updated, deleted, restored), user events (registered, login, invited, role changed, page visits), access requests, function calls, integration and automation executions, agent conversations, data imports, file uploads, and security checks.
* **Setup:** Changes to how your app is built and configured. This includes app lifecycle events (created, published, unpublished), entity schema changes, payment and OAuth integration setup, and domain changes.
To focus on one category, use the category dropdown above the table and select **All Categories**, **Runtime**, or **Setup**.
 The Logs page shows events for this app only. Workspace-level events, such as member and billing changes, are available to enterprise workspaces through the [Audit Logs API](/developers/references/audit-logs-api/get-started/overview).
***
## Filtering logs
Use the controls above the table to focus on the events you care about.
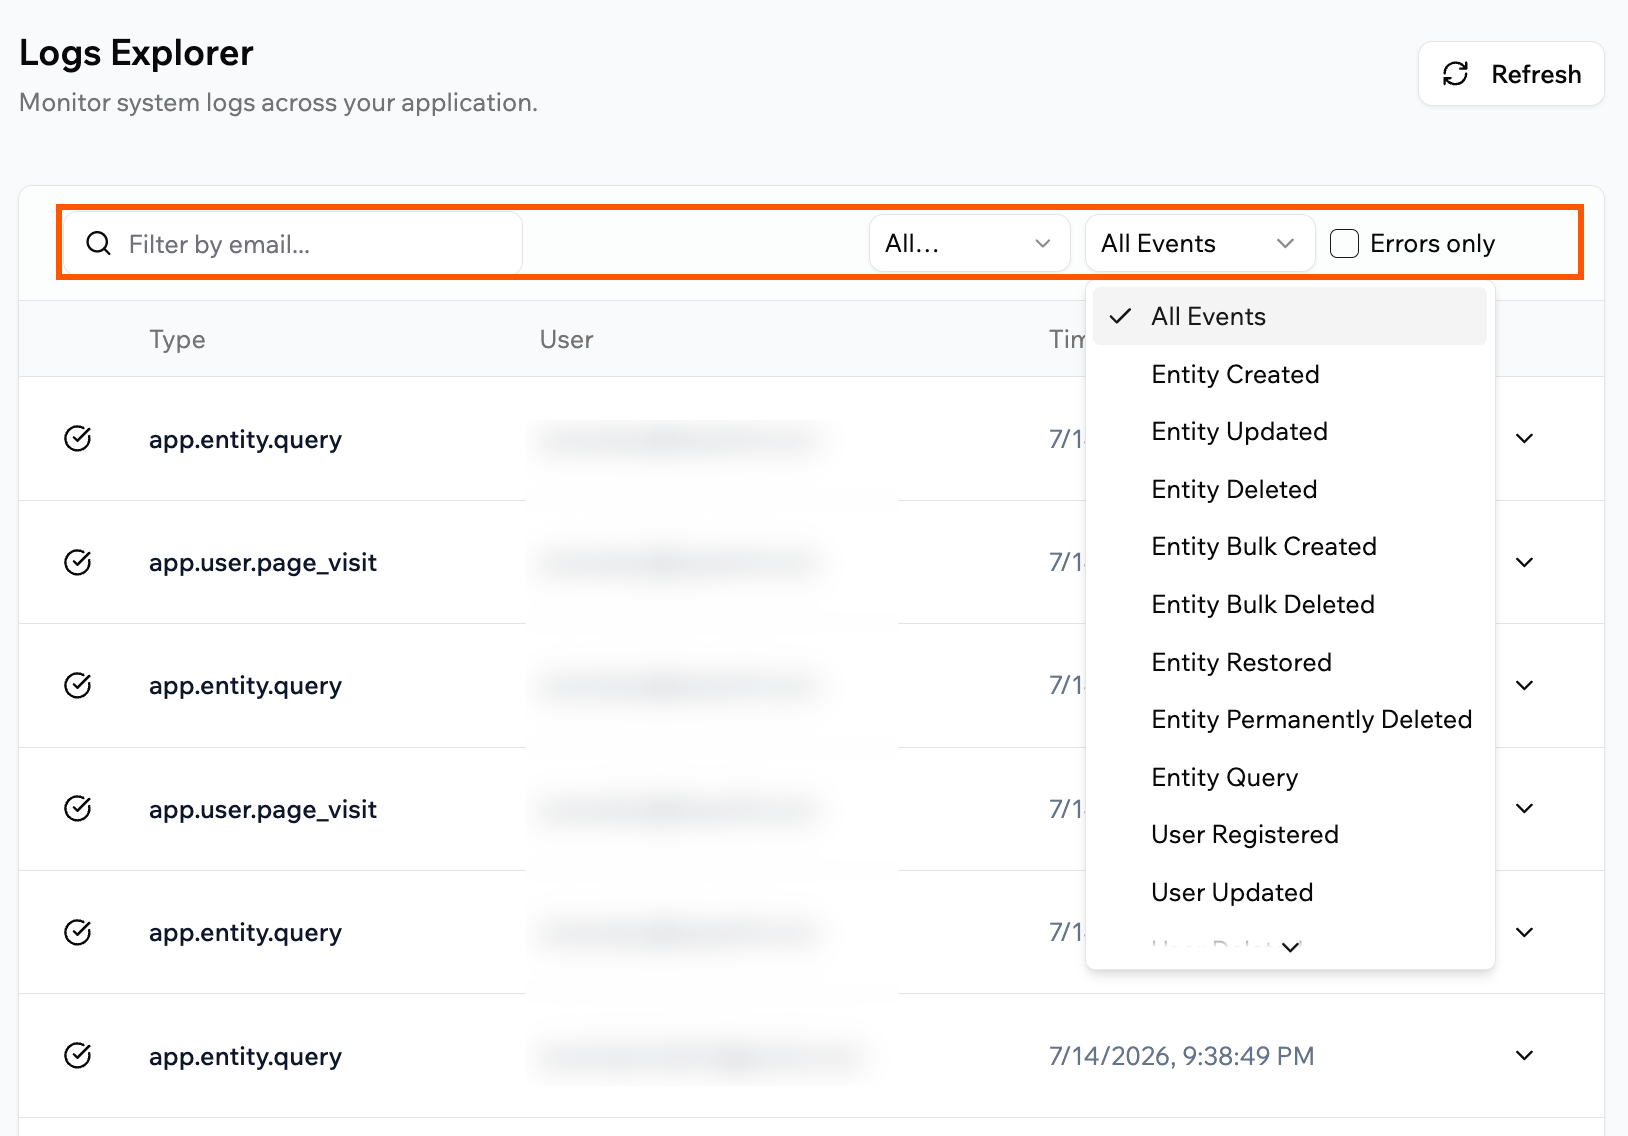
* **All Events dropdown:** Filter by a specific event type, such as **Entity Updated** or **Function Call**.
* **Filter by email:** Enter an email address to see one person's activity.
* **Errors only:** Turn this on to show only failed events.
Use **Refresh** to load the latest events, and the **X** next to the filters to clear them.
The Logs page shows events for this app only. Workspace-level events, such as member and billing changes, are available to enterprise workspaces through the [Audit Logs API](/developers/references/audit-logs-api/get-started/overview).
***
## Filtering logs
Use the controls above the table to focus on the events you care about.
* **All Events dropdown:** Filter by a specific event type, such as **Entity Updated** or **Function Call**.
* **Filter by email:** Enter an email address to see one person's activity.
* **Errors only:** Turn this on to show only failed events.
Use **Refresh** to load the latest events, and the **X** next to the filters to clear them.
 Troubleshooting a report from one of your app users? Filter by their email and turn on **Errors only** to see exactly which of their actions failed.
***
## Viewing event details
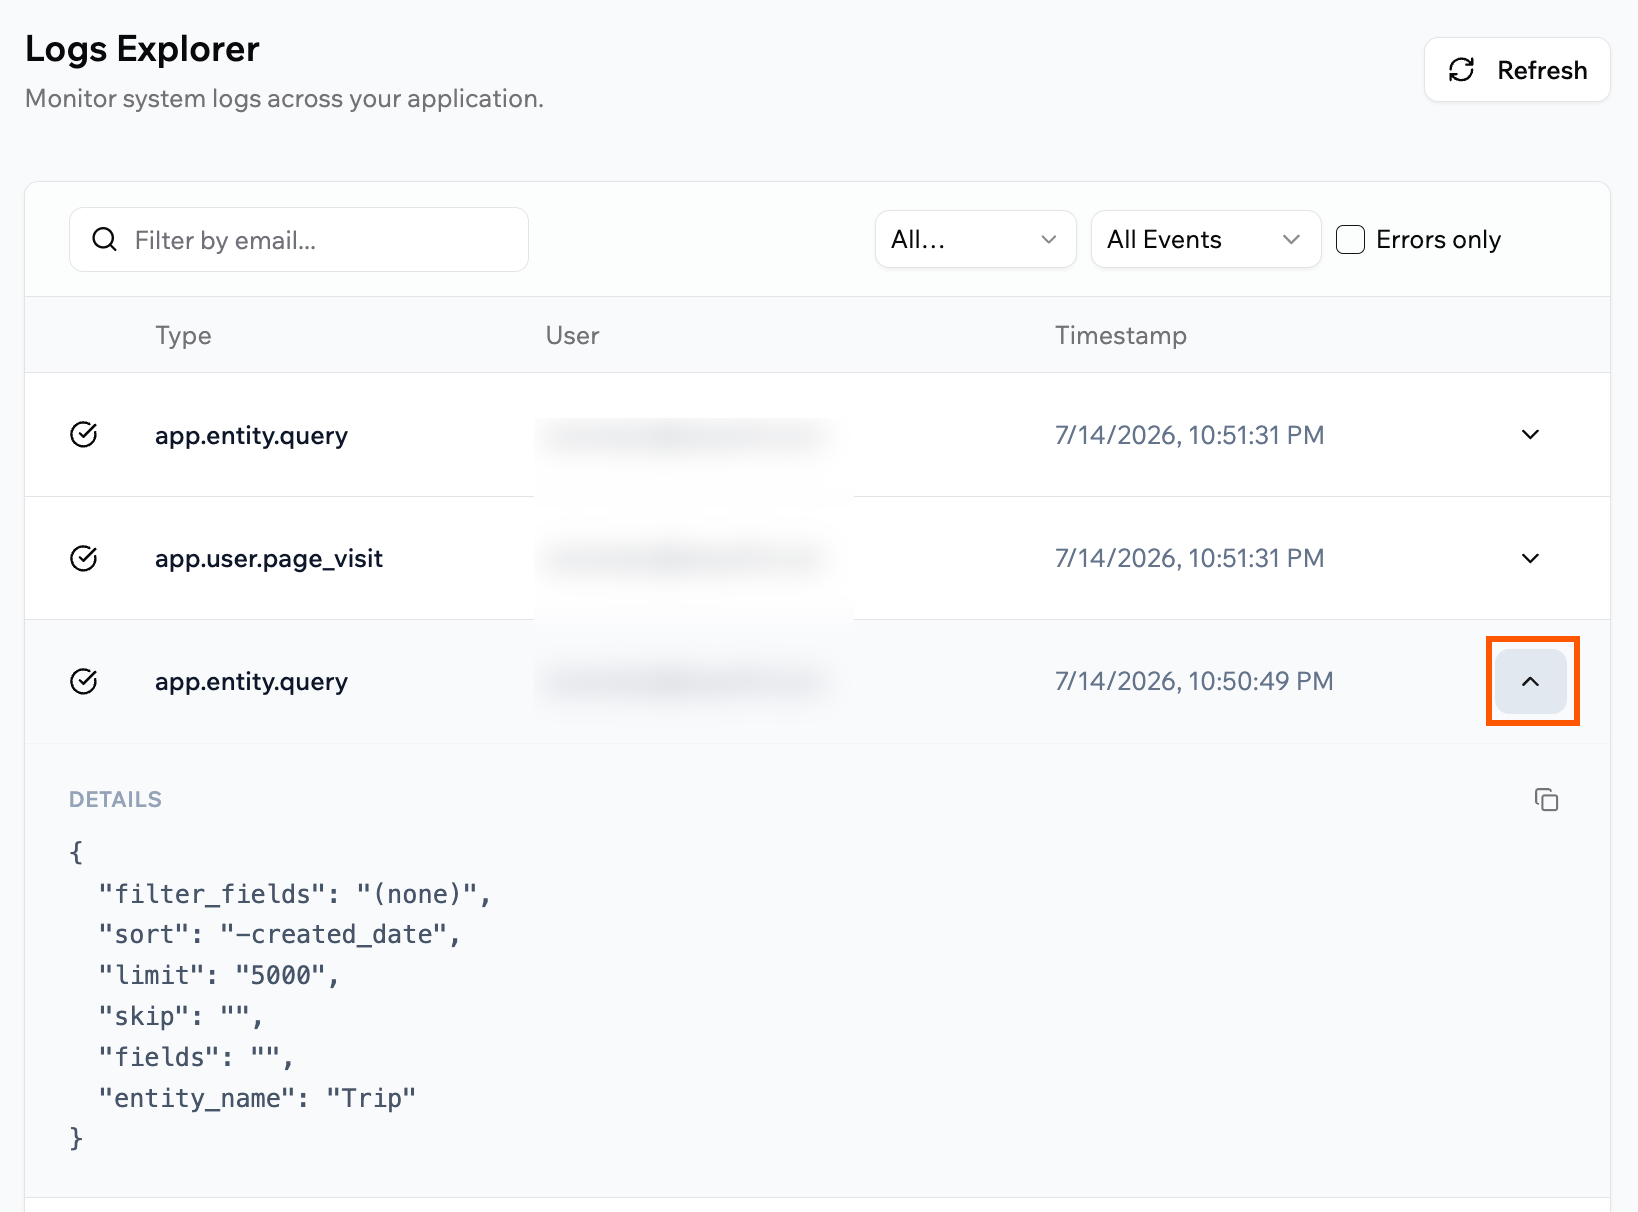
Click a log row to expand it. Depending on the event, you can switch between different views.
* **Details:** The full metadata of the event, such as the entity and fields involved.
* **Outputs:** What the event produced, for example a function's response.
* **Error:** The error message, when the event failed.
To copy the full event data, click the **Copy** icon in the expanded row.
Troubleshooting a report from one of your app users? Filter by their email and turn on **Errors only** to see exactly which of their actions failed.
***
## Viewing event details
Click a log row to expand it. Depending on the event, you can switch between different views.
* **Details:** The full metadata of the event, such as the entity and fields involved.
* **Outputs:** What the event produced, for example a function's response.
* **Error:** The error message, when the event failed.
To copy the full event data, click the **Copy** icon in the expanded row.
 ***
## FAQs
Click a question below to learn more about your app logs.
Logs appear once there is activity in your app. If the table stays empty, open your app, perform an action such as creating a record, then click **Refresh**.
No. Analytics summarizes traffic and usage trends, while logs record individual events with full details. Use analytics to understand how your app performs and logs to investigate specific actions.
Yes. Filter the event type to **Function Call** to see each invocation. For live debugging while you build, you can also use the activity monitor in the code editor.
***
## FAQs
Click a question below to learn more about your app logs.
Logs appear once there is activity in your app. If the table stays empty, open your app, perform an action such as creating a record, then click **Refresh**.
No. Analytics summarizes traffic and usage trends, while logs record individual events with full details. Use analytics to understand how your app performs and logs to investigate specific actions.
Yes. Filter the event type to **Function Call** to see each invocation. For live debugging while you build, you can also use the activity monitor in the code editor.